|
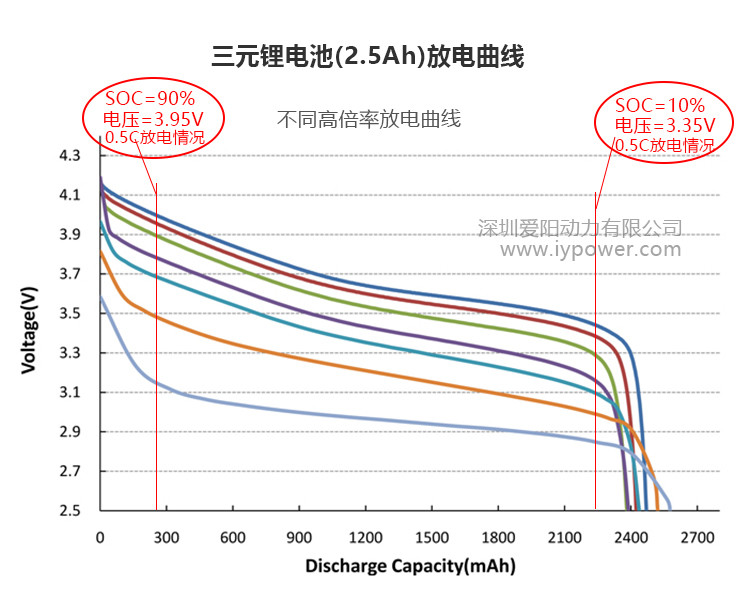
Lithium battery charging and discharge curve, SOC curve analysis The lithium battery charging and discharge curve reflects the many information of the battery itself. You can understand the many performance of the battery through the discharge curve. You can know the capacity information of the battery through the battery discharge curve. We mainly analyze the condition of power batteries for analysis. The power lithium batteries are mainly ternary lithium batteries and lithium iron phosphate batteries. The voltage range of the ternary lithium battery is 2.8V ~ 4.2V, the typical value is about 3.6V, and the three -yuan lithium battery voltage platform is relatively steep; The voltage range of lithium iron phosphate batteries is 2.5V ~ 3.65V, and the typical value is about 3.2V. The voltage platform of lithium iron phosphate batteries is relatively flat; (Shenzhen iypower Co., Ltd. / www.iypower.com) 1.Triple lithium battery (battery) discharge curve as follows:
The above figure is a 18650 cell, and the battery capacity is 2500mAh. The relationship between the voltage and discharge capacity of the battery and the actual battery is the curve of the voltage and discharge capacity of the battery. The capacity of the ternary lithium battery is mainly concentrated at about 3.35V ~ 3.95V, and 80%of the capacity is concentrated in this voltage section. In addition, there are several discharge curves in the picture above, mainly the discharge curve corresponding to different discharge multipliers. The discharge multipliers, low discharge curves, low discharge multipliers, and high discharge curves.
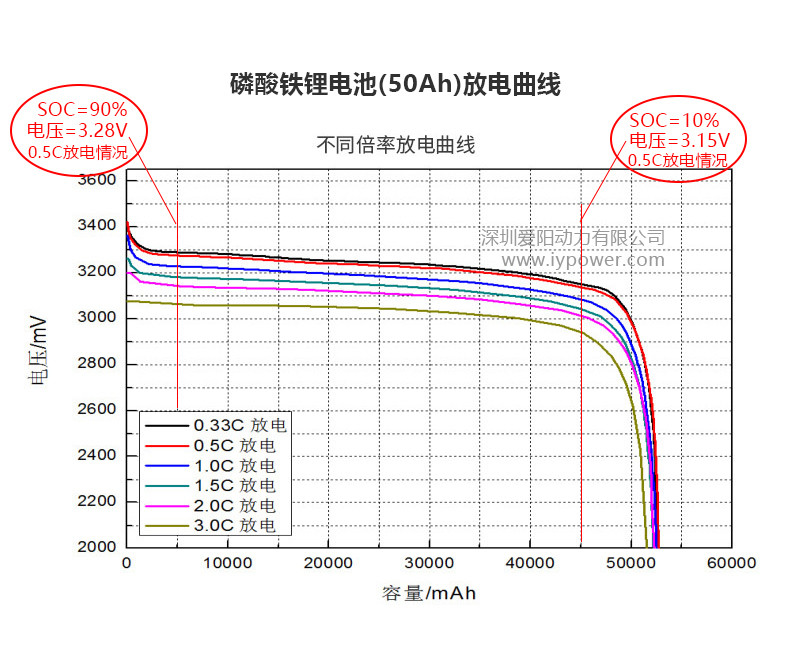
2.Lithium iron phosphate battery (battery) discharge curve diagram is as follows:
The picture above shows a power cell with a lithium iron phosphate square cell with a battery capacity of 50AH. Charging and discharge curve and the actual relationship of the voltage and discharge capacity of the battery can be reacted by the following information through the figure above: The capacity of lithium phosphate batteries is mainly concentrated at about 3.15V ~ 3.30V, and 80%of the capacity is concentrated in this voltage section. In addition, there are several discharge curves in the picture above, mainly the discharge curve corresponding to different discharge multipliers. The discharge multipliers, low discharge curves, low discharge multipliers, and high discharge curves. In addition to the relationship between the discharge curve of the lithium battery, the temperature has a lot to do with the temperature, and the different temperature discharge curves are different. Shenzhen iypower Co., Ltd. iypower, not only the motivation |

Copyright © 2016 Dongguan Aiyang Power New Energy Co., Ltd. All rights reserved 粤ICP备15022706号